
September 21, 2026
Record Payouts and a Safer Operating Base
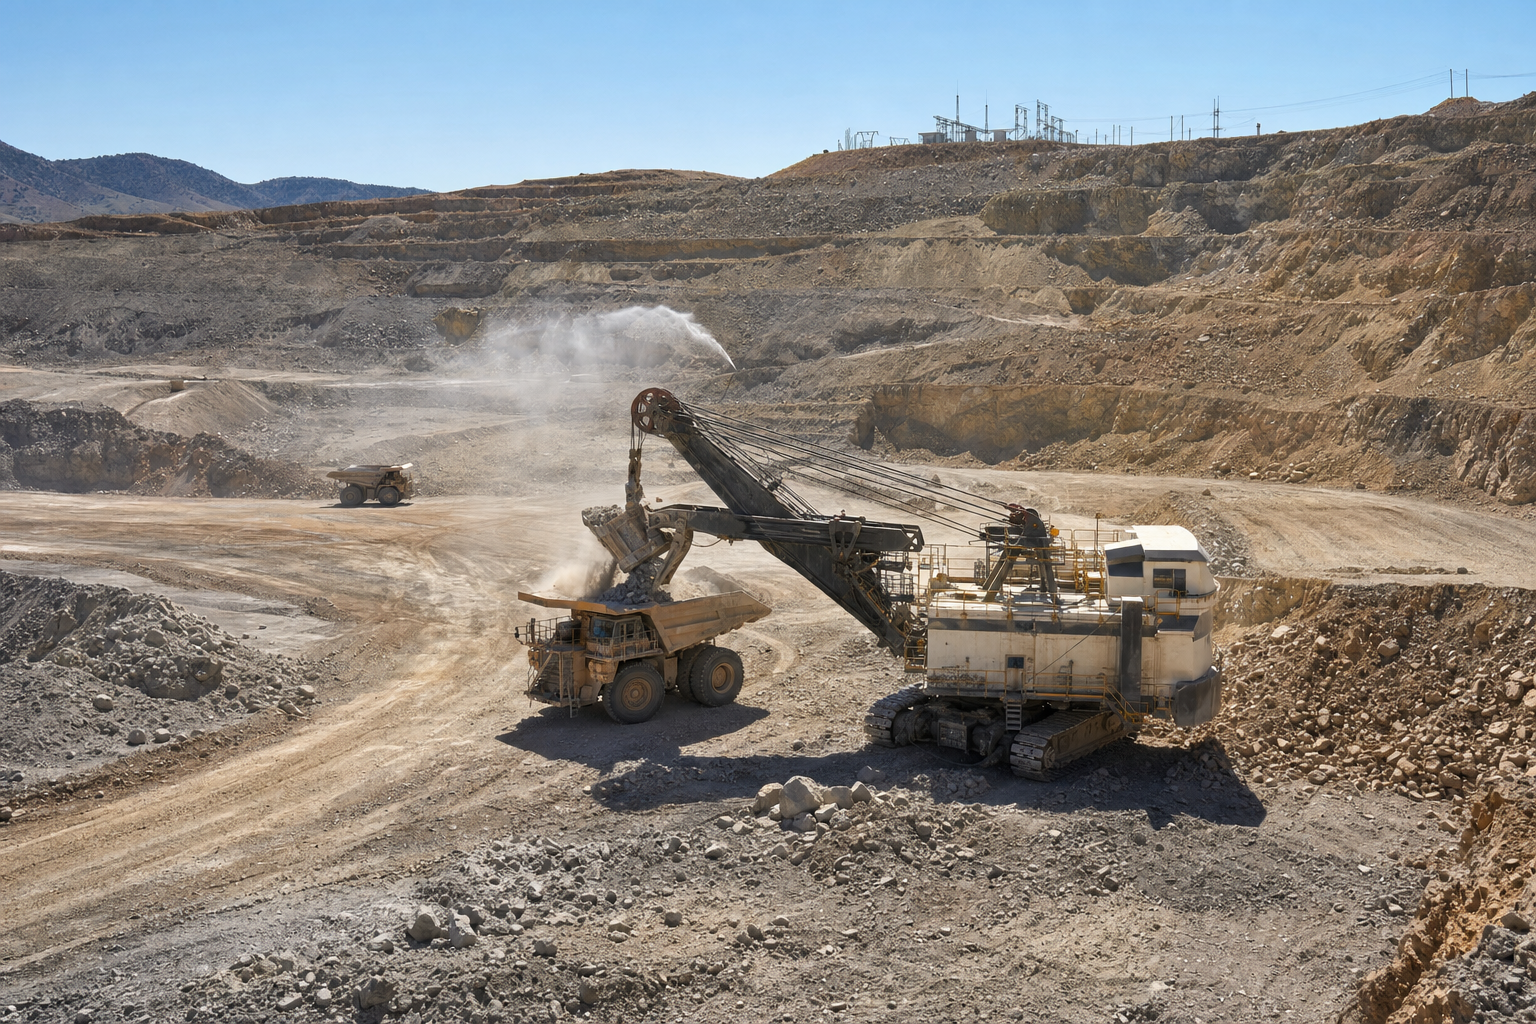
Major gold producers delivered $18.2 billion in government payments, the highest on record, underscoring the sector’s fiscal footprint across key jurisdictions. Taxes, royalties and related state levies rose alongside sustained production and solid pricing, directing a larger share of cash flows to public finances. At the same time, safety performance continued to improve, with operators reporting safer mines and a lower incidence of serious events. The industry’s operating profile today is characterized by stronger compliance and risk controls, even as regulatory expectations and stakeholder scrutiny increase.
Emissions and Energy Intensity Move Higher
Set against those gains is a clear rise in emissions and energy intensity. Power consumed per ounce produced has trended upward across major producers, and associated greenhouse-gas footprints have followed. This divergence—safer workplaces and higher state contributions on one side, greater environmental load on the other—heightens ESG complexity for boards and lenders. It also puts a sharper focus on mine power procurement, processing efficiency and the timing of decarbonization investments. While individual outcomes vary by orebody, process route and grid mix, the aggregate direction points to more energy required per unit of output and, with it, elevated emissions profiles.
These trends can influence cost structures through fuel usage, electricity sourcing and compliance expenditures, and may shape permitting dynamics where climate policies tighten. They also feed into counterparties’ due‑diligence processes, as gold supply chains continue to face expanding disclosure requirements on carbon and environmental performance. Operators balancing near‑term cash distribution, life‑of‑mine planning and capital allocation for emissions reduction will remain in focus as stakeholders assess the durability of margins under evolving ESG baselines.
What to Watch
- Trajectory of emissions and energy intensity metrics relative to throughput and grade trends.
- Shifts in power sourcing strategies at mine sites, including any reconfiguration of on‑site generation or grid contracts aimed at lowering emissions and volatility in input costs.
- The interaction between higher government take and capital budgets for efficiency and decarbonization, particularly at mature assets.
- Ongoing safety performance, with attention to whether operational changes tied to energy management affect workforce risk profiles.
The physical market remains insulated from mine‑site operating variability: once refined to accepted specifications, gold is fungible, and allocated bullion ownership reflects title to finished metal rather than exposure to individual asset ESG performance.